Where’s Oregon’s Education Dashboard?
More money. Fewer students. Growing bureaucracy. Where’s the transparency?

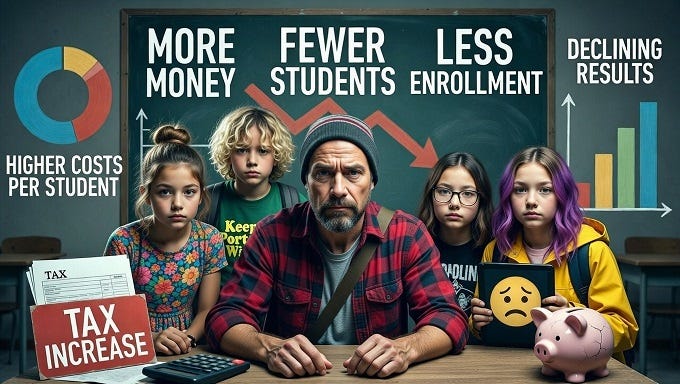
There’s a strange disconnect happening in Oregon education right now.
On the Capitol steps in Salem this week, KPTV Reports educators gathered to demand more funding. One teacher told reporters that some high school classes are “up in the 40s,” warning that without additional state dollars, classrooms will continue to suffer.
That story is powerful. Teachers are passionate. The optics are strong.
But then you start reading the rest of the headlines.
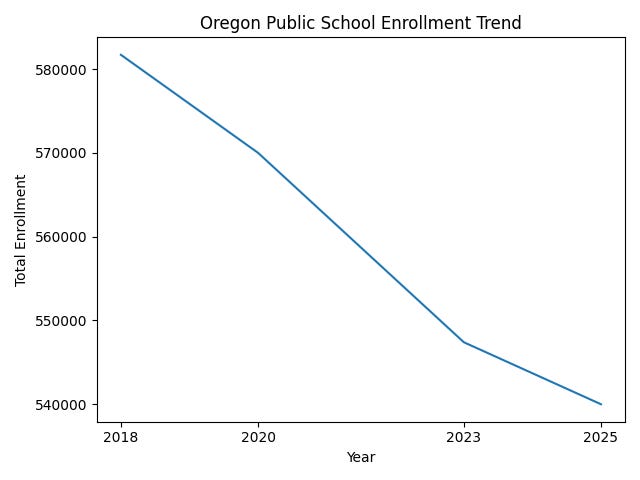
Last November, OPB reported that Oregon’s public school enrollment has fallen dramatically since the pandemic — more than 37,000 fewer students compared to 2020.
OregonLive followed up with a blunt question: “Where are all the kindergartners?” pointing to continued declines in incoming students and a statewide enrollment slide that hasn’t reversed.
And Willamette Week added another layer to the puzzle: even as enrollment shrank, Oregon’s education workforce grew — by nearly 17% since 2020 — with much of that growth occurring outside direct classroom instruction.
Let’s pause there.
Enrollment down.
Workforce up.
Funding demands increasing.
If you’re a taxpayer, you might reasonably ask: how much are we spending per student right now, and how does that compare nationally?
That’s where things get murky because Oregon does not provide a simple, centralized, transparent “education dashboard” that clearly shows cost, staffing ratios, and outcomes in one place.
But the data does exist.
According to recent analysis of state spending, Oregon’s per-pupil funding reached roughly $17,988 per student in the 2022-23 school year and that is nearly double what the state spent two decades ago.
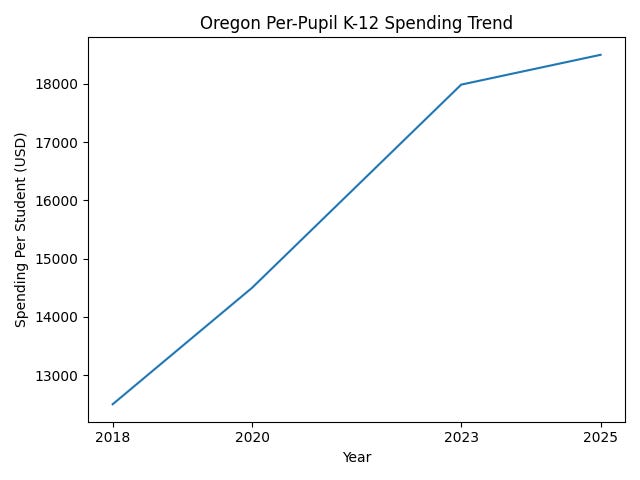
National comparisons consistently place Oregon at or above the U.S. average in per-student spending, depending on the data source and year measured.
Yet academic outcomes — reading proficiency, math performance, and attendance — have not climbed in tandem. OPB’s reporting on chronic absenteeism shows that regular attendance rates remain below pre-pandemic levels and lag national norms.
So here we are.
We are spending close to $18,000 per student.
We are educating tens of thousands fewer students than five years ago.
We have added staff while classrooms shrink in enrollment.
We are hearing urgent calls for more funding.
And what we do not have is a clean, official, publicly accessible dashboard that answers the most basic questions.
How much is Oregon spending per student, all sources combined, this year?
What is the average class size statewide?
What is the administrator-to-classroom teacher ratio?
How many instructional aides are there per certified teacher?
What percentage of total spending reaches direct classroom instruction?
Where does Oregon rank nationally in outcomes relative to spending?
These are not partisan questions. They are governance questions.
Every major public system in Oregon now publishes dashboards — public health, employment statistics, transportation safety. Yet the largest budget category in the state — K-12 education — does not have a straightforward, apples-to-apples comparison tool that lets parents and taxpayers see performance, cost, and staffing metrics side by side.
Instead, we get piecemeal reporting. One outlet tells us enrollment is collapsing. Another tells us staffing is rising. Another tells us funding is inadequate. And unless you’re willing to spend hours digging through PDFs and fiscal reports, you can’t easily see the full picture.
Transparency shouldn’t require a graduate degree in public finance.
If Oregon’s education system is underfunded, a dashboard would prove it.
If administrative growth is crowding out classroom resources, a dashboard would show it.
If Oregon is delivering strong outcomes for the money, that should be front and center.
But the absence of a simple statewide report card invites suspicion. It fuels distrust. And it allows every side to cherry-pick the data that fit their narrative.
Which raises an uncomfortable question.
If Oregon had a fully transparent Education Dashboard — cost per student, staffing ratios, classroom sizes, graduation rates, proficiency scores, national rankings — updated annually and easy to access — who would object?
Because something tells me not everyone would be thrilled to see the receipts laid out in plain view.
Oregon doesn’t need another rally.
It doesn’t need another press release.
It needs transparency.
And if we’re going to spend nearly $18,000 per child, the public deserves to know exactly how it’s performing.
That’s not anti-education.
That’s pro-accountability.
Oregon also doesn’t maintain any kind of centralized repository or database of the 197 district collective bargaining agreements that drive all the costs. You can’t log in and see that Portland teachers get X% increase each year that exceeds available revenue. It’s intentional.
Great work Ben! Fact is that Oregon has a higher rate of students on IEPs than Washington and California, and a lower rate of graduation than Washington and California. Is that because we are so good at determining when students need extra help? The answer to that question is a definite NO because our graduation rates are very low. Throwing taxpayer dollars at the problem isn’t working. Lower rates of graduation 2025 was an embarrassing 81%. Ai results suggest that Oregon has gone back to having standards for graduation, yet an article in The Hill states, that Oregon high school students won’t have to prove basic mastery of reading, writing or math to graduate from high school until at least 2029, the state Board of Education decided unanimously…extending the pause started in 2020. https://thehill.com/opinion/education/4288044-oregon-just-dropped-all-graduation-standards-failing-all-of-its-students-in-the-name-of-equity/. Transparency offered through the Oregon Dept. of Education? That’s the last thing they want.